Before getting started with this guide, please know that the following are required in order to connect you iHealth devices to ChronicCareIQ.
- Smart Phone
- Set Up ChronicCareIQ account
- Link iHealth to ChronicCareIQ
- Linked iHealth Glucometer (iOS or Android)
Taking Readings with Your iHealth Smart Glucometer
Before proceeding with this guide, please make sure you have your iHealth Smart Glucometer nearby and that it is charged.
- Launch the iGluco App.
- Click the Measure button at the bottom. *If you are using an Android device, the button will be on the bottom right, as shown below on the right.
- The iGluco App will now begin searching for your iHealth Smart Glucometer.
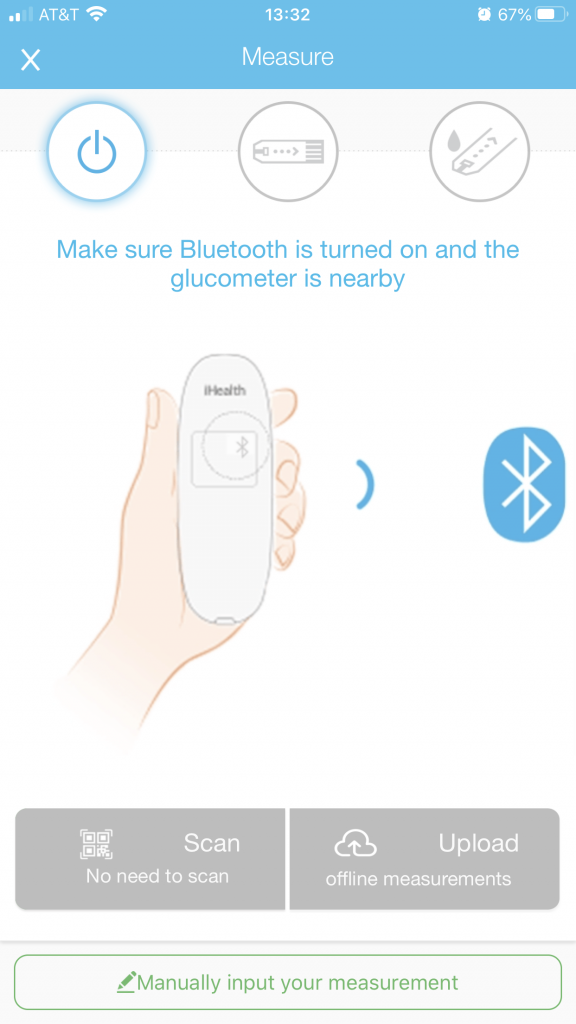
- If the iGluco App connected to your iHealth Smart Glucometer, your Glucometer’s Bluetooth light will be lit up and you will be shown a screen similar to the following.
- Insert your test trip into the iHealth Smart Glucometer.
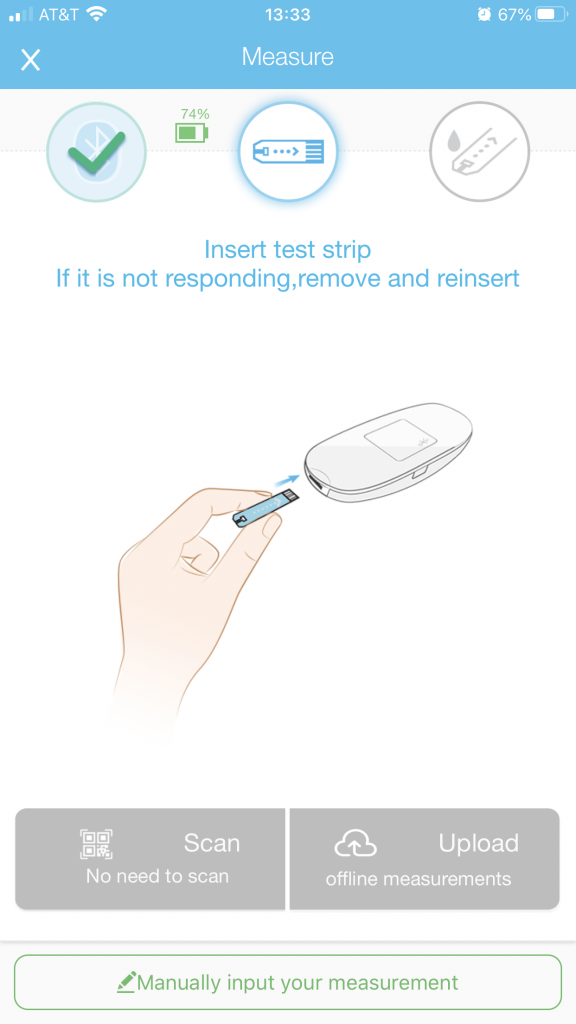
- Once the test strip has been inserted, you will be shown the following screen.
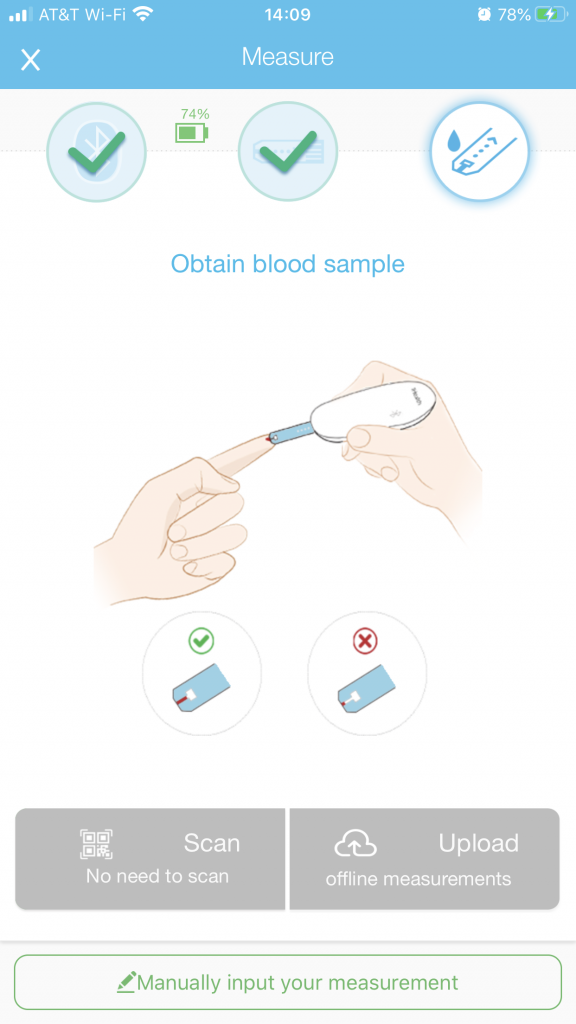
- You may now take your Blood Sample.
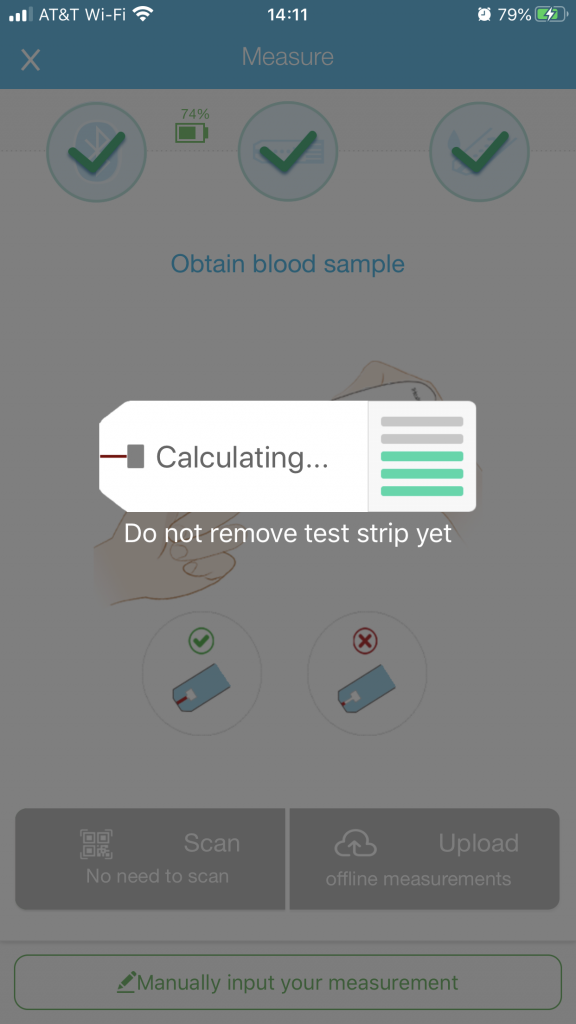
- Once you have obtained your Blood Sample, your iHealth Smart Glucometer and iGluco app will begin calculating your blood sugar. You will quickly be shown the following screen.
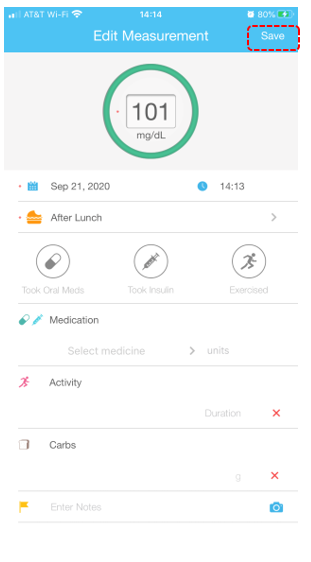
- Once the iHealth Smart Glucometer has successfully taken your Blood Sugar, you will be shown the results on a screen similar to the following.
- Once you have read over your readings, click Save in the upper right hand corner of the screen.
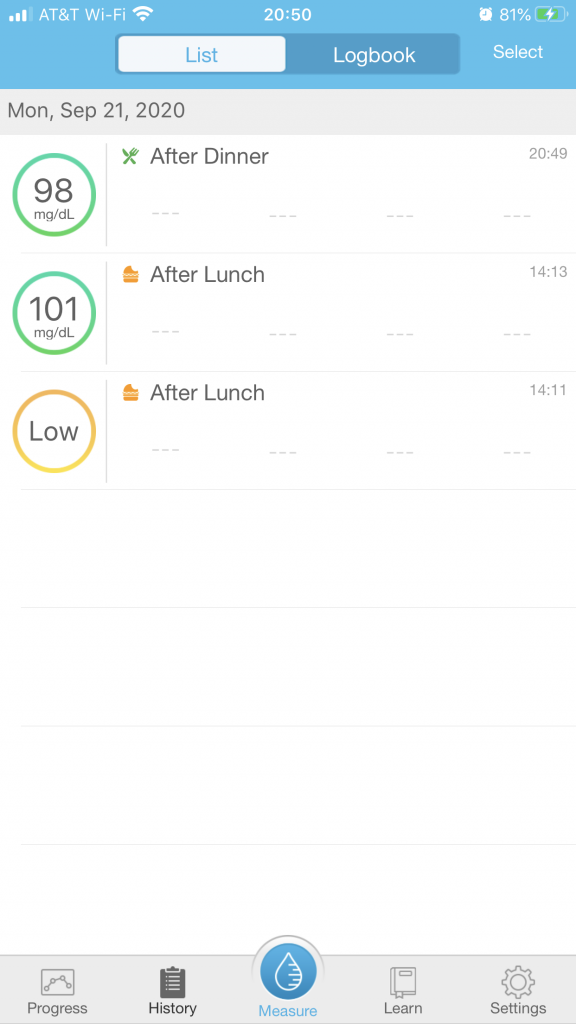
- After saving your results, you will be brought to the History tab. Here, you will be able to view all your previous Blood Sugar Readings.
- The history tab will resemble the following screen.
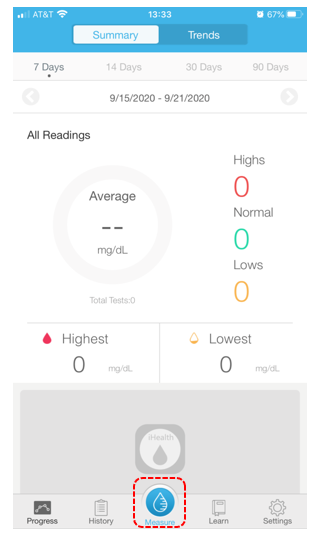
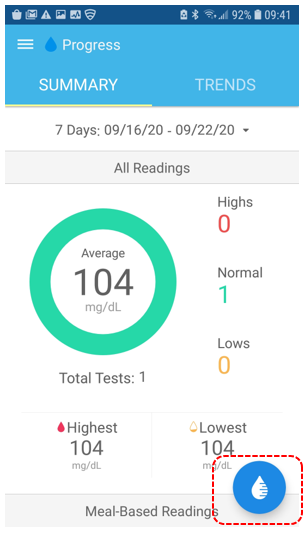
Viewing Your Blood Sugar Averages
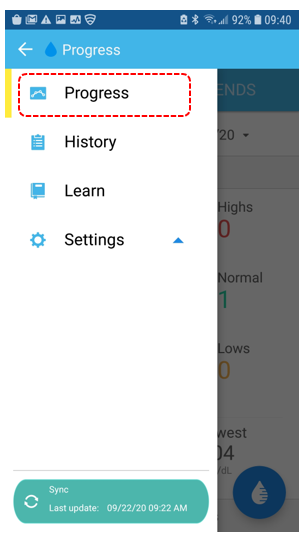
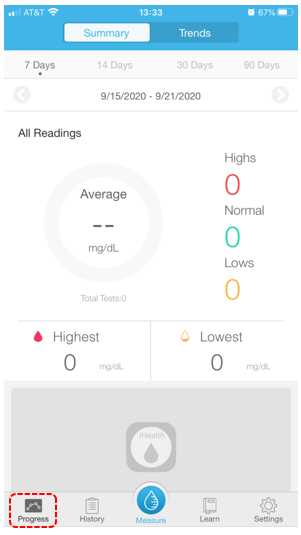
- From any tab in the iGluco App, click on Progress at the bottom of the screen. *If you are using an Android device, you will need to access the Progress tab through the iGluco menu, as shown below on the right.

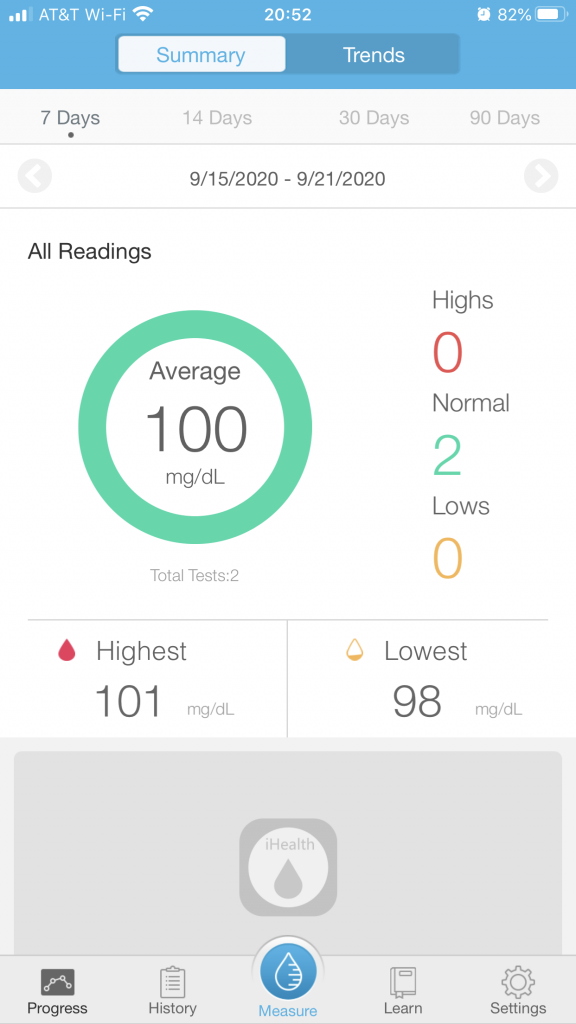
- Your screen should now resemble the following. From here, you will be able to view your blood sugar averages, your lowest and highest blood sugar readings, and the number of blood sugar readings that have been high, low, and normal.
- You will also be able to change the time period of your averages by clicking 7 Days, 14 Days, 30 Days, or 90 Days at the top of the screen. For example, if you’d like to be shown your average blood sugar over the last 30 days, you would click on 30 Days.
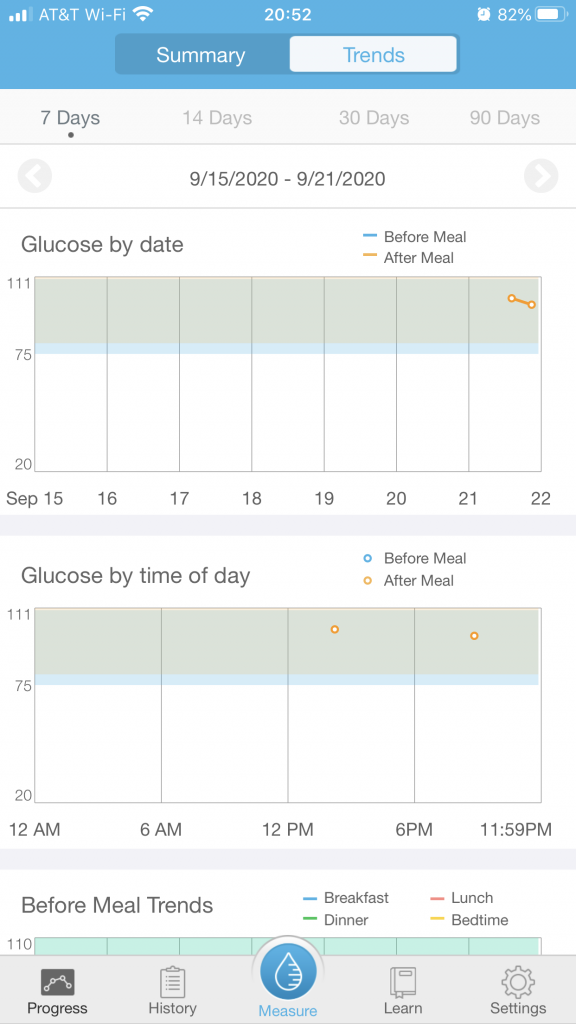
Viewing Your Blood Sugar Trends
- From any tab in the iGluco App, click on Progress at the bottom of the screen. *If you are using an Android device, you will need to access the Progress tab through the iGluco menu, as shown below on the right.

- Click on Trends at the top of the screen.
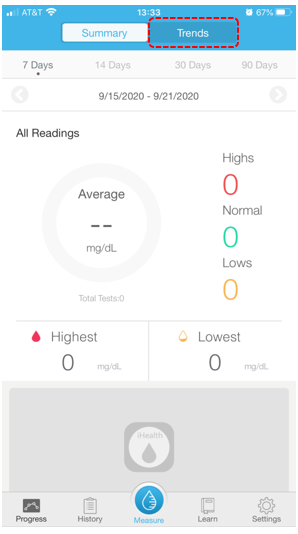
- Your screen should now resemble the following. From here, you will be able to see charts that track your Glucose by date and Glucose by time of day.
- You will also be able to change the time period the graphs show by clicking 7 Days, 14 Days, 30 Days, or 60 Days at the top of the screen.